When it comes to server monitoring, I’m a bit of a geek. Actually, it’s probably accurate to say that the server monitoring applications installed on my VPS use more of the server’s resources than actual web visitors!
So yeah, I probably (definitely) go overboard when it comes to monitoring my VPS.
But if you want to focus on a single monitoring solution, which do you choose? If you’re an enterprise user, and looking to monitor from a hardware or protocol level, Nagios is the industry standard system. However, for the purposes of this blog post, I’ll be looking at SaaS solutions for SME’s and personal users (like me!).
1. New Relic

The first SaaS solution I’ll be covering is New Relic, which focuses on application performance monitoring. This involves looking at monitoring from an app level. Whether your app is built on PHP, Ruby, Node.js, .Net, Java, or Python, they fully support each language.
This said, their growing selection of services includes server monitoring, which is free.
Key Features:
- Free server monitoring
- Broad selection of other services
On a side note, New Relic filed for IPO back in November, and are now being traded on the NYSE, with a bright future ahead of them.
2. Boundary
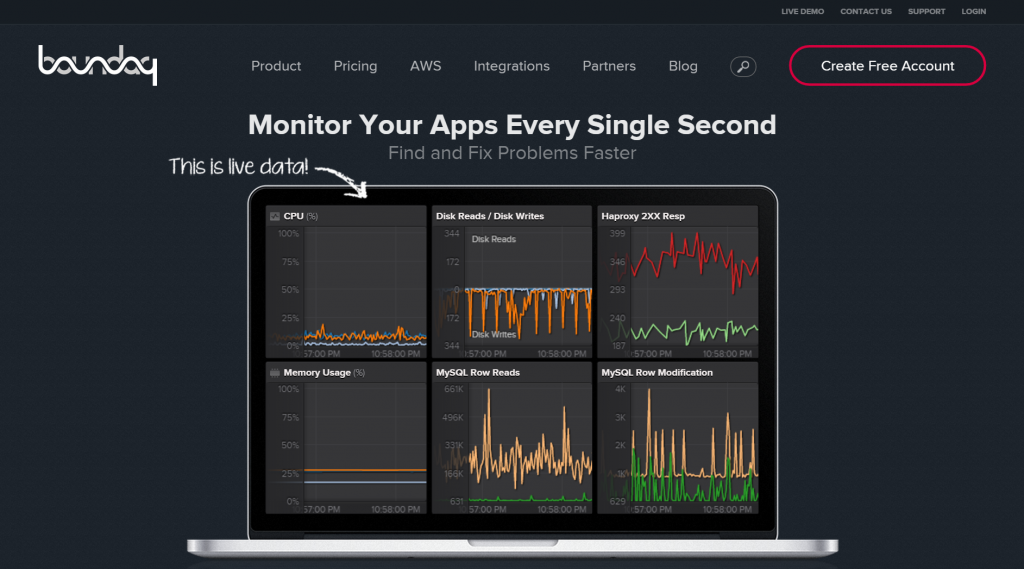
Boundary has a big focus on the network side, with a ‘dashboard’ that can be adjusted to your requirements. For example, if you have a team dedicated to monitoring Apache servers, you can create a dashboard which is solely dedicated to displaying real-time Apache statistics.
Key Features:
- Monitor up to 10 servers free
- Customisable dashboards
- Can monitor AWS instances, making use of AWS CloudWatch. Here’s more info on how their service integrates with AWS
- Excellent support via live chat and email
If you’ve got a big screen and want it to be full of geeky real-time graphs, Boundary is for you!
3. Server Density

Server Density seems similar to Boundary (mentioned further up this post), but is more customisable in terms of the dashboard.
Key Features:
- Highly customisable dashboard
- Integration with Amazon Web Services, Rackspace Cloud, and Google Cloud
- 15 day free trial
- On premise version also available
With 8 different pricing plans ranging from $10 to $500 per month, they aim to cater for all types of users.
4. NodeQuery

NodeQuery works well if you want a fairly straightforward and simple dashboard, that covers the hardware side of things. They do a really good job at keeping the UI simple, which can be a hard thing to do.
Key Features:
- Simple UI
- In beta stage, so currently free to use