When looking through my Twitter feed earlier today, I noticed CloudFlare announced they’d rolled out HTTP/2 to all clients who use SSL/TLS connections.
I’ve been using CloudFlare on a few of my personal sites for a while now, with good results, and saw their blog post earlier in the year mentioning HTTP/2 – so today’s announcement was great to see!
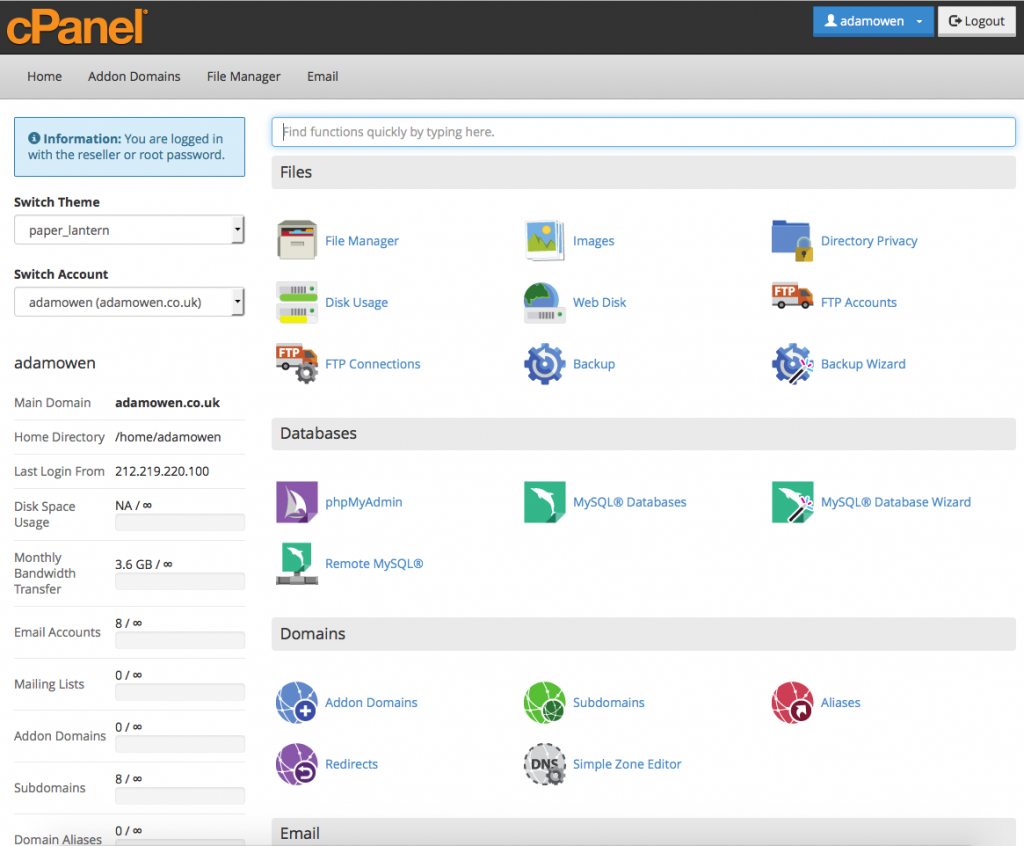
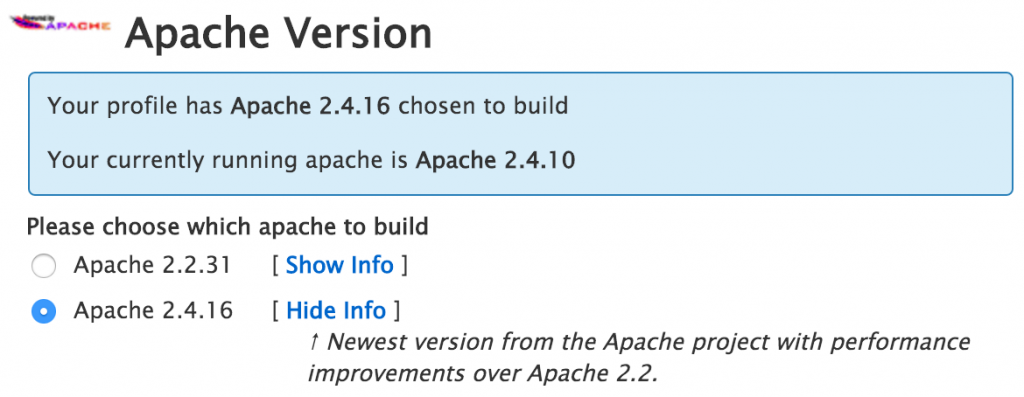
We’d looked into HTTP/2 at the office the other week, but we’re using cPanel/WHM & Apache on our production server, and with EasyApache not yet supporting the latest Apache 2.4.17 (which includes the required mod_http2), we were left waiting patiently for the update to appear in EasyApache.
Using CloudFlare’s HTTP/2 instead
But hey, CloudFlare just announced HTTP/2, so why wait?!
Since I still wanted to have have the live (non-HTTP/2) site as a comparison, I used WHM’s Transfer Tool to create an exact copy of the website on a dev server.
I was initially going to setup a sub-domain for testing, but realised CloudFlare doesn’t support CNAME pointing on their free plans, so I ended up using a spare domain we had in our Namecheap account.
After setting up the domain in CloudFlare and pointing the DNS records (which took less than a minute to propagate), I just needed to update the database (for a Magento site in this case) to reflect the new domain.
I also created a quick self-signed SSL certificate in WHM, then set the SSL feature in CloudFlare’s panel to ‘Full’. (side note, if you’re not already taking advantage of CloudFlare’s free SSLs, grab an account and try it out for yourself – you’ll never need to buy an SSL certificate again!).
To minimise CloudFlare’s CDN having too much of an impact on results, I disabled as many of CloudFlare’s caching features as I could.
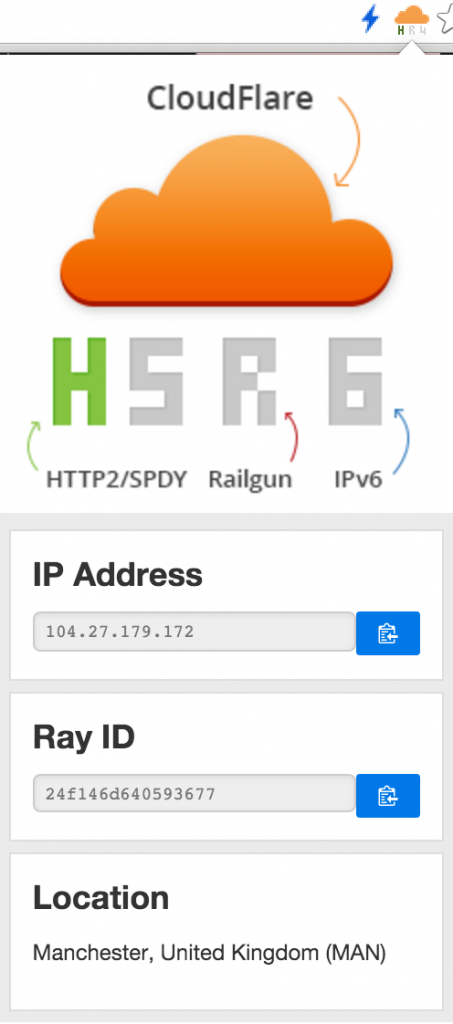
*checking HTTP/2 is working, using the CloudFlare Claire Chrome Extension
Ready to benchmark!
Results – Comparing HTTP/1 vs HTTP/2
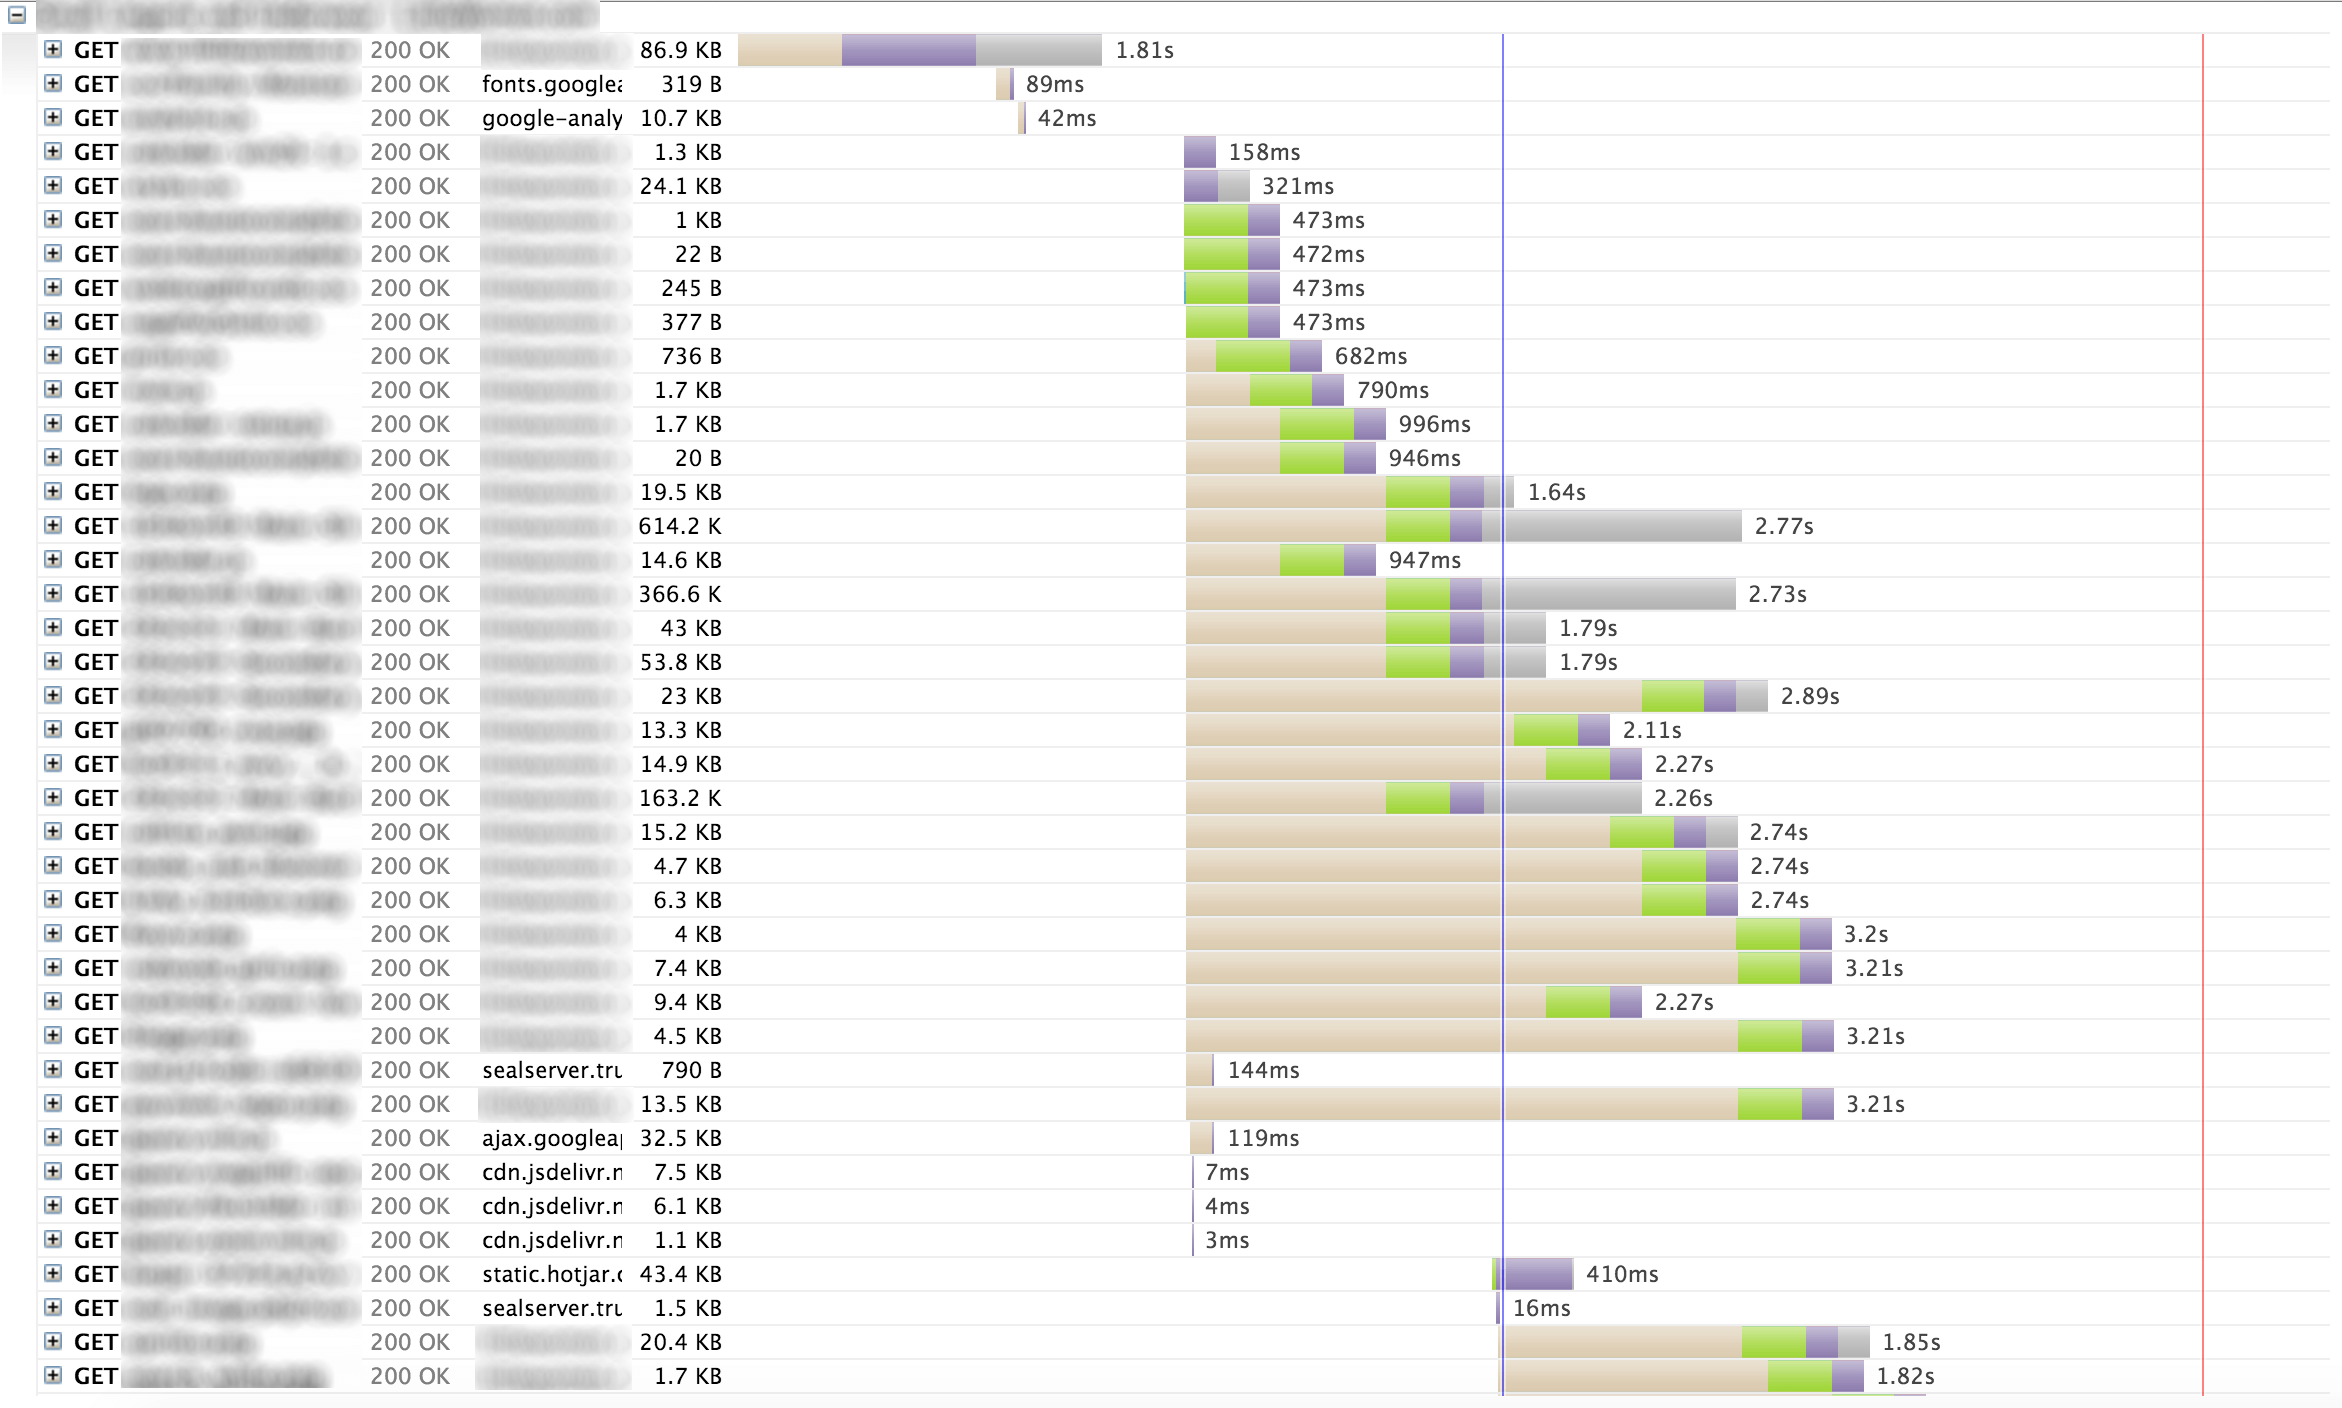
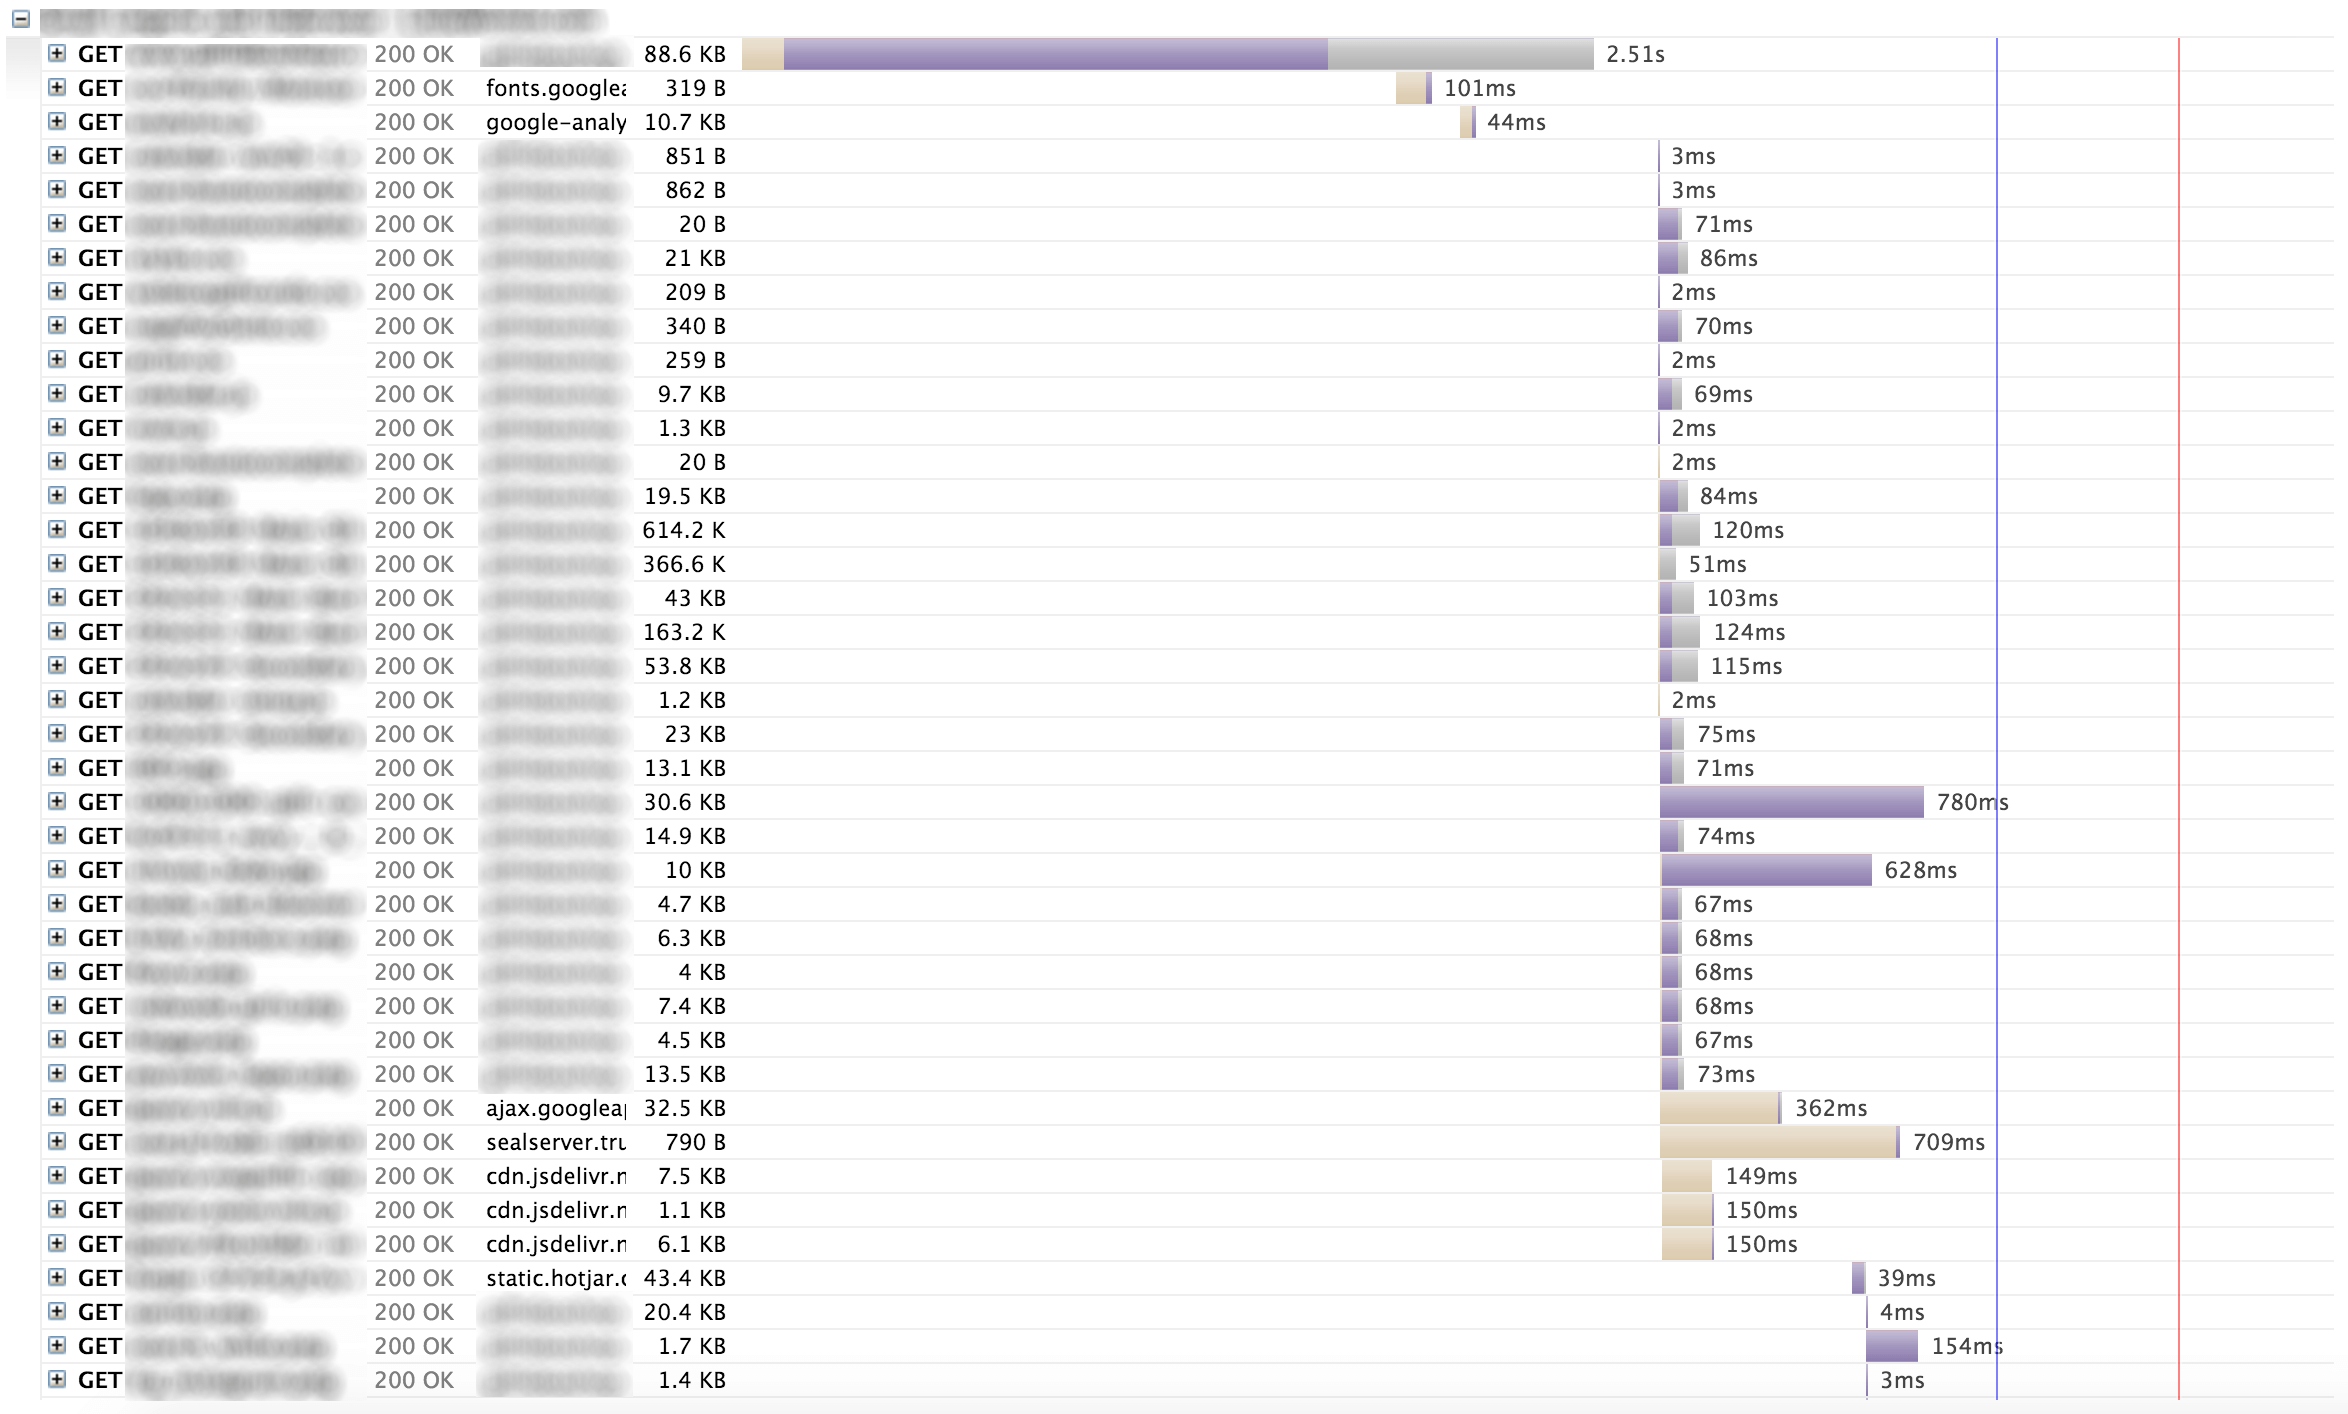
So here are the results (after running each site through GTMetrix):
Supporting only a few parallel resource downloads, we can see that using HTTP 1.0 delays the loading of resources on our web server by just over 3 seconds.
By comparison, the dev site I setup gathers (almost) all resources in parallel via a single TCP connection – adding no more than a second to the load time.
I’d like to also note that the standard website is on our production server (latest spec, SSDs etc), whereas the HTTP/2 dev environment is on an older-spec development server. This should explain the difference in initial connection times for those wondering.
I’m interested to see how HTTP/2 unfolds over the next few weeks. If anyone uses New Relic’s Real User Monitoring or similar, I’d love to see a screenshot showing average load times for website visitors before and after HTTP/2 roll-out.
In the meantime, I’ll see if I can gather a few screenshots comparing real-user load times before and after.
Any comments welcome!
